Gemini AI can now automatically convert spreadsheets into charts
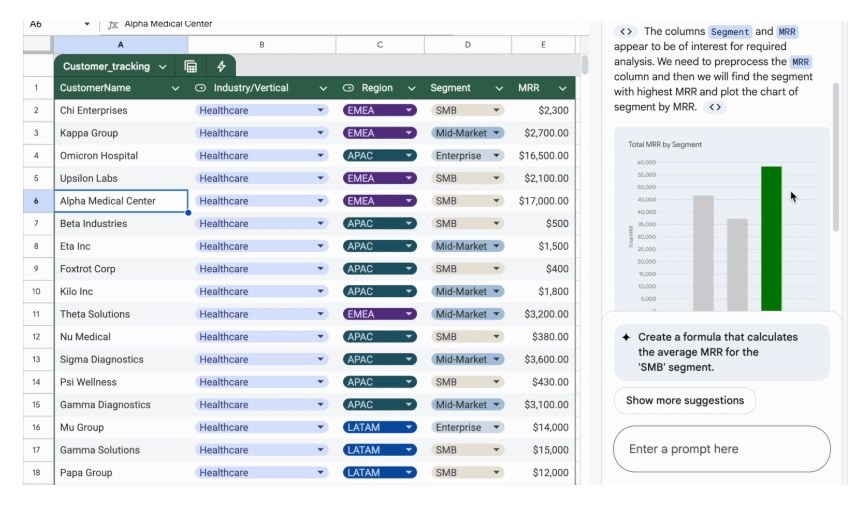
Google has added a new feature to Gemini: a chatbot that can answer questions about data in a spreadsheet, provide insights into trends, and create charts.
Google has added a new feature to Gemini: a chatbot that can answer questions about data in a spreadsheet, provide insights into trends, and create charts.

Google has added a new feature to Gemini: a chatbot that can answer questions about data in a spreadsheet, provide insights into trends, and create charts.
The company says Gemini does all this by creating and running Python code, then analyzing the results. For simpler queries, it can use regular spreadsheet formulas. Most importantly, it can save users from the tedious work and headaches that usually come with creating data visualizations.

Google warns that AI-generated visualizations are static images, so you'll have to ask Gemini to create new ones every time the data is updated.
Additionally, Google warns that Gemini's accuracy can be affected by things like inconsistent data formatting or missing values, as well as prompts that aren't specific enough about what the user wants.
The new feature is scheduled to launch by February 20th, joining other Gemini features that Google recently added to its standard Workspace business plans, whether users wanted it or not.
It will be available on most Workspace plans and for users of the Google One AI premium plan for $19.99 per month.