UNIT.City — місце, де люди працюють... КРАЩЕ! Обирай свій простір просто зараз 👉
Наталя ХандусенкоMoney
23 March 2026, 13:28
2026-03-23
In 2025, IT-individual entrepreneurs sent almost UAH 20 billion to the budget: what does the calculation of taxes for one individual entrepreneur look like by industry?
In 2025, 1.8 million individual entrepreneurs paid UAH 90 billion in taxes. Compared to 2024, the number of individual entrepreneurs increased by 4.4%, and tax revenues increased by a quarter. The largest shares of individual entrepreneurs are in trade and the IT sector. At the same time, representatives of other industries pay the most taxes per individual entrepreneur, and in some regions, IT is displacing traditional industries.
In 2025, 1.8 million individual entrepreneurs paid UAH 90 billion in taxes. Compared to 2024, the number of individual entrepreneurs increased by 4.4%, and tax revenues increased by a quarter. The largest shares of individual entrepreneurs are in trade and the IT sector. At the same time, representatives of other industries pay the most taxes per individual entrepreneur, and in some regions, IT is displacing traditional industries.
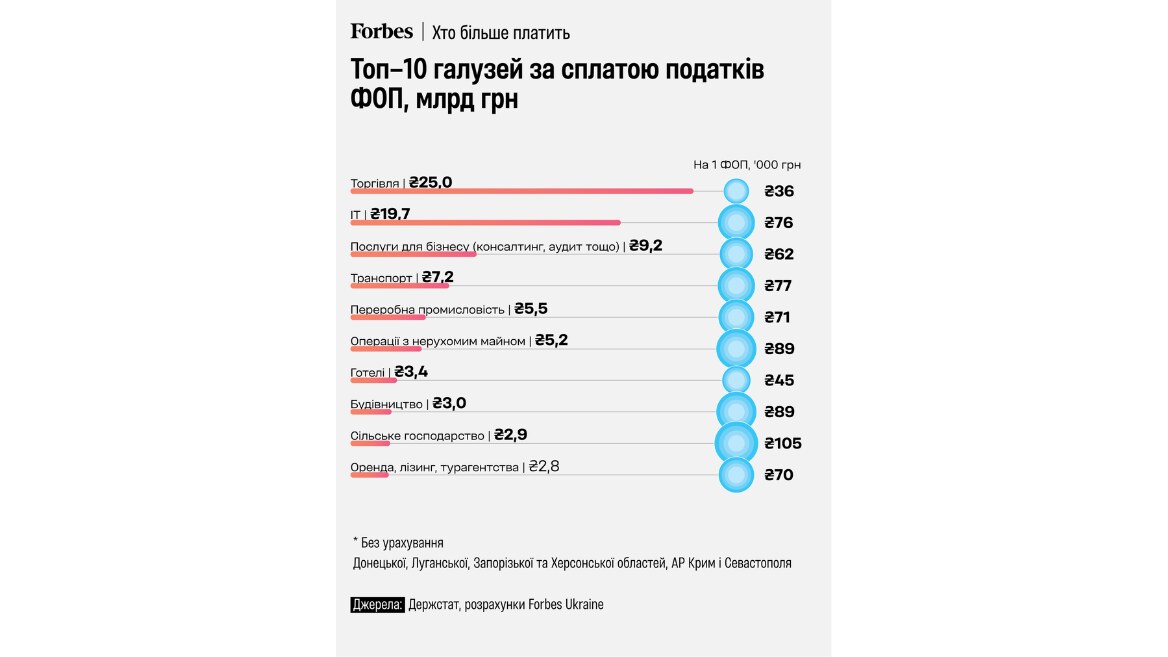
Every second hryvnia of taxes is paid by individual entrepreneurs in trade (25 billion UAH) and the IT sector (19.7 billion UAH), Forbes Ukraine reports .
However, in terms of tax burden per entrepreneur, farmers (105,000 UAH per year), as well as representatives of the construction and real estate sectors (89,000 UAH each) became the leaders.
For comparison, the IT sector shows an indicator of 76,000 UAH, while trade - 36,000 UAH.
The publication notes that only industries with a total number of individual entrepreneurs over 1,000 were taken into account, and accruals for salaries of employees were not taken into account.
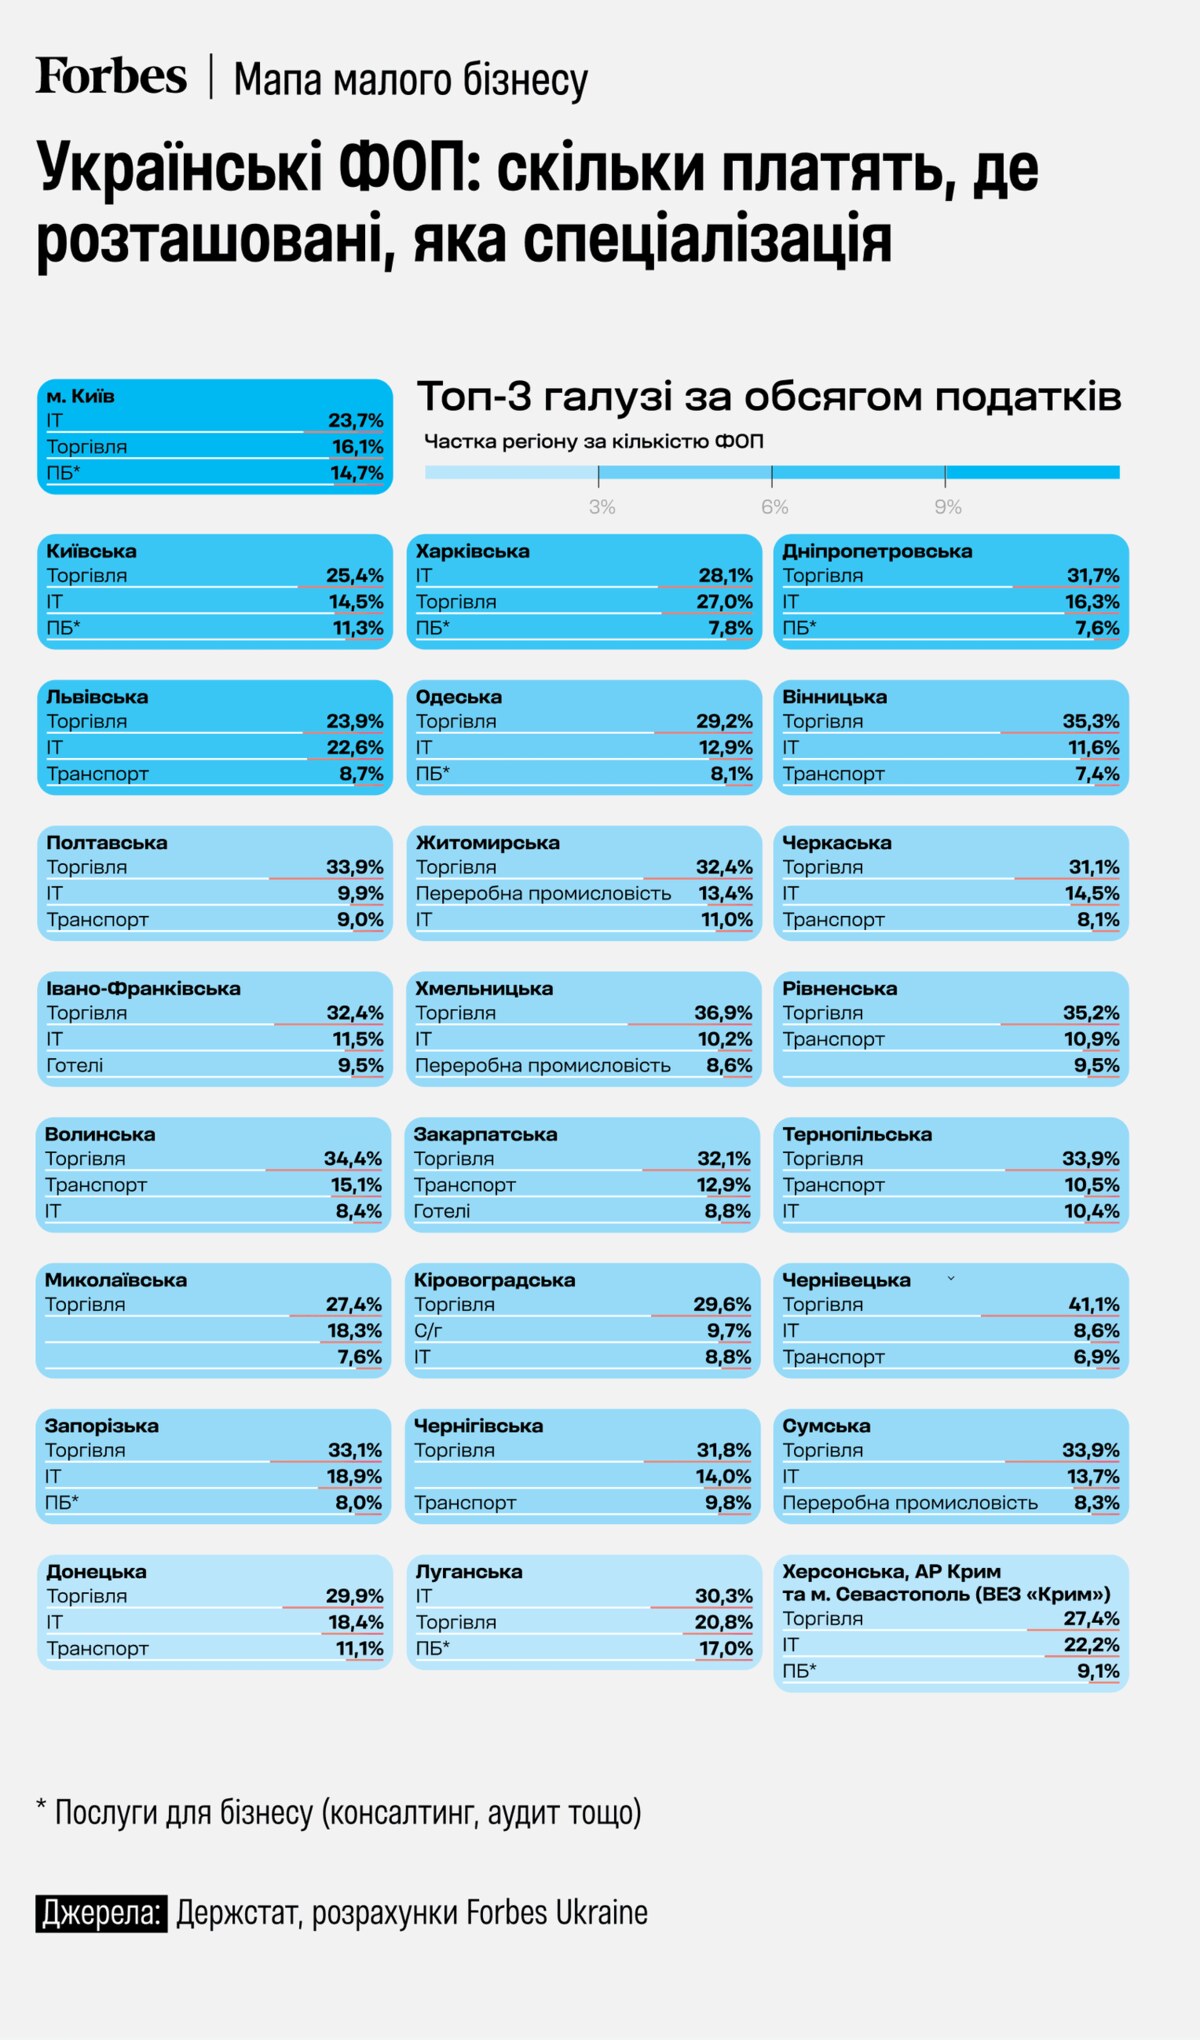
All-Ukrainian statistics show the leadership of trade and IT. In Kharkiv region, the IT sector came in first place, overtaking trade: 28.1% versus 27.0%. In Kyiv, IT is also in first place: 23.7% versus 16.1% of trade.
However, there are interesting regional contrasts. For example, in the Transcarpathian region, IT did not enter the top 3 at all.
In Zhytomyr region, the processing industry came in second place (13.4%), leaving IT in third place (11.0%). In Kirovohrad and Mykolaiv regions, agriculture was in the top three — 9.7% and 7.6%, respectively.