UNIT.City — місце, де люди працюють... КРАЩЕ! Обирай свій простір просто зараз 👉
Наталя ХандусенкоHot News
5 March 2025, 19:28
2025-03-05
Since 2014, the number of IT companies in Ukraine has increased by over 40%: how IT specialists' salaries have changed over 10 years
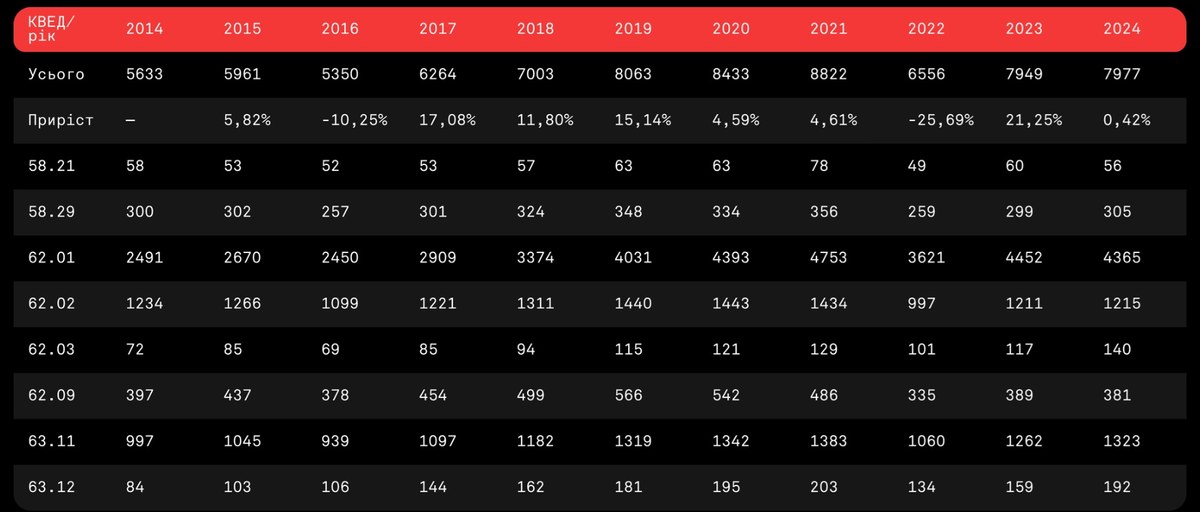
Over 10 years, the number of IT companies has grown to 7,977 — this is the figure as of 2024. For comparison, in 2014 there were 5,633, and the largest number was in 2021.
Over 10 years, the number of IT companies has grown to 7,977 — this is the figure as of 2024. For comparison, in 2014 there were 5,633, and the largest number was in 2021.
This is stated in the AIN.UA study "10 Years of Ukrainian IT".
The average annual growth rate of IT companies was 4.5% per year.
The largest number of IT companies appeared in 2017–2019: the average growth during this period was 14.7%. With the onset of the COVID-19 pandemic, the pace slowed down: in 2020, the number of companies increased by only 4.6%, in 2021 - by another 4.6%.
With the beginning of Russia's full-scale invasion of Ukraine, the number of companies experienced the largest drop in 10 years: in 2022, their number decreased by 25.7%. At the same time, in 2023, it increased by 21.25%.
Source: AIN.UA
Number of IT specialists
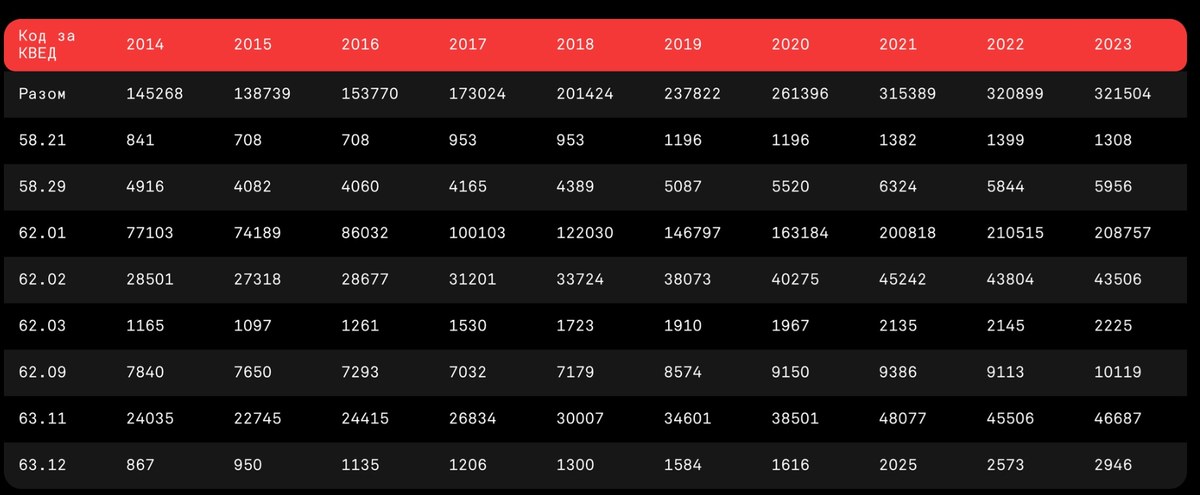
In 2023, the number of specialists in Ukrainian IT was 321,500, the study notes.
In general, the number of employed workers increased in all KVEDs during 2014–2023. Only 2015 was characterized by a decrease in their number: by 6,500 people or 4.5%. The largest increase occurred in 2021: +20.7% compared to the previous year. In 2022–2023, the growth rate slowed down and amounted to approximately +1% per year.
Source: AIN.UA
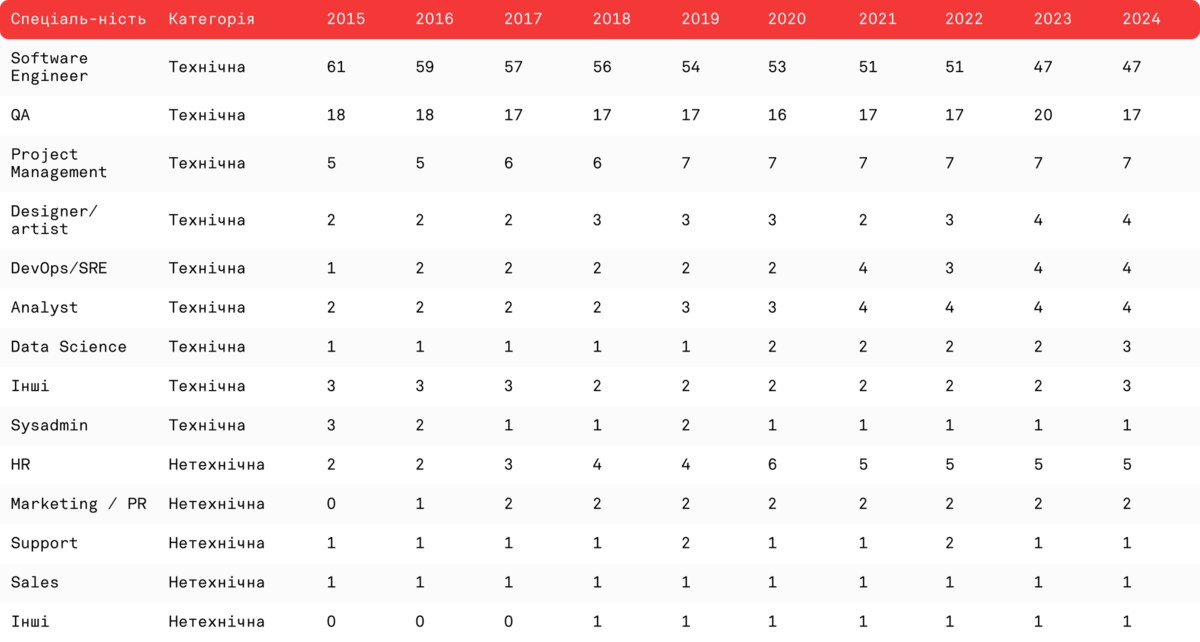
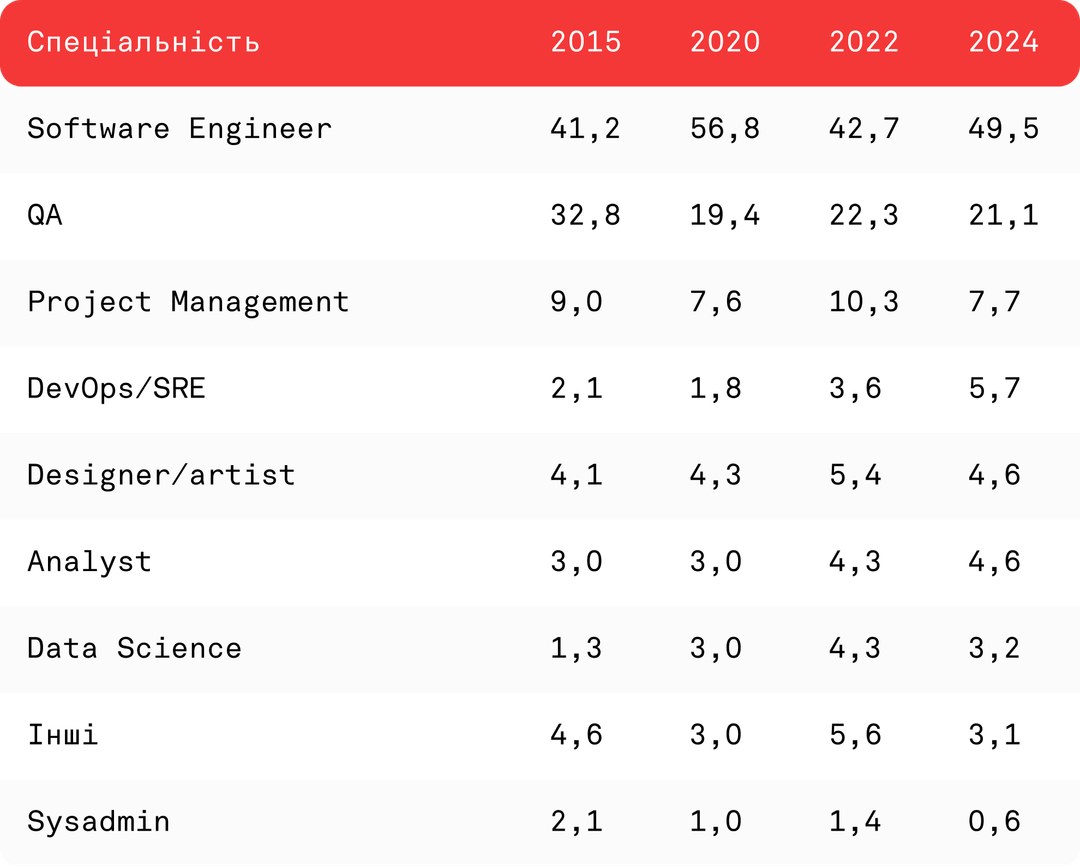
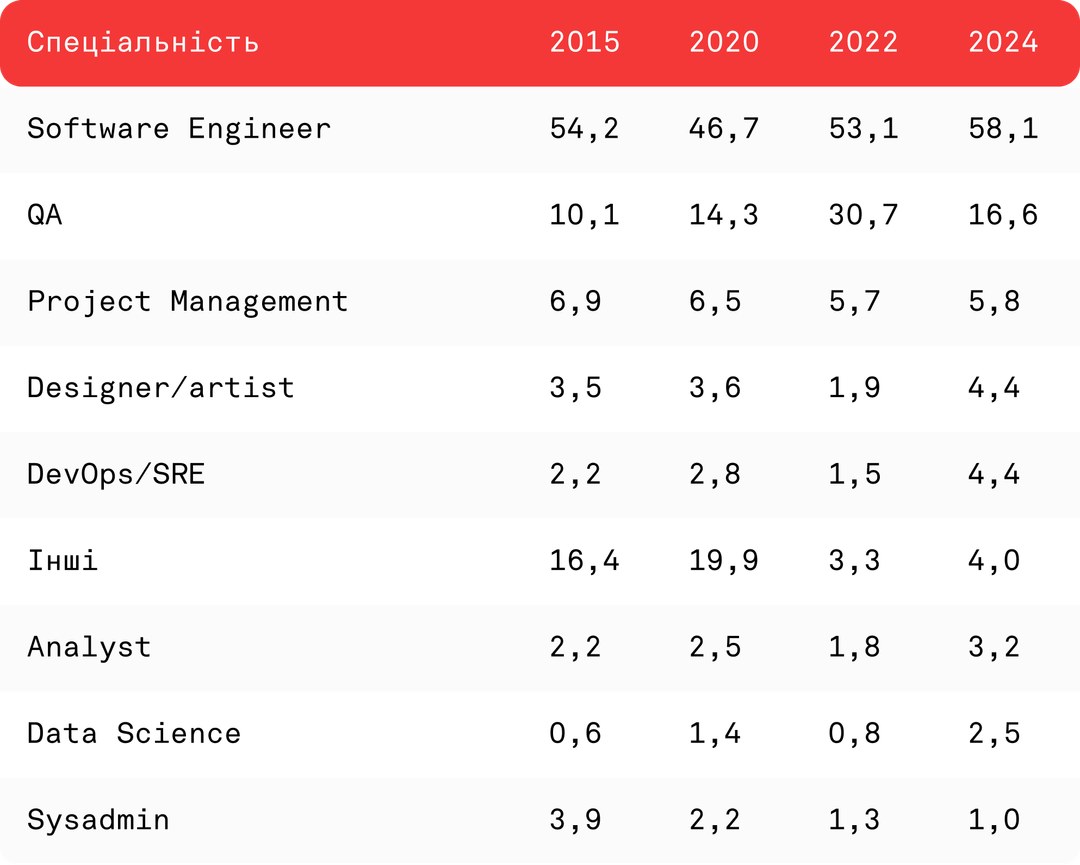
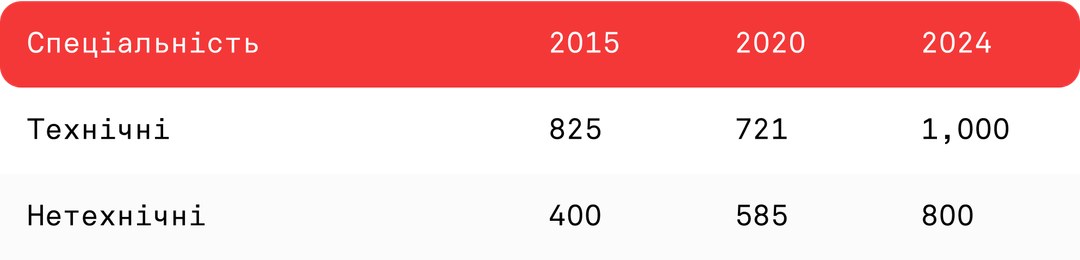
Over nine years, the proportion of specializations in the IT market has changed: from 96% technical specialties versus 4% non-technical in 2015 to 90% versus 10% in 2024, respectively.
The share of developers has also decreased: from 61% of all specialists in 2015 to 47% in 2024. The number of system administrators has also changed: in 2015 they made up 3% of the total market, as of 2024 — 1%. An increase in the number of analysts and designers has been noted (change from 2 to 4%).
The growth of non-technical specialists primarily concerns the dynamics of such specialties as HR specialists (from 2 to 5%) and marketers (from 1 to 2%).
Source: AIN.UA
At the same time, the number of Senior Software Engineers fluctuated within 11% of the total share. As of 2015, they accounted for 21.2% of all IT workers, the historical minimum was recorded in 2019 — ~15%, the historical maximum in 2024 — 26%.
NumberThe number of Middle and Senior specialists among non-technical specialties is growing: as of 2024, they will account for 4% and 4.4%, respectively, of the total number of all employees.
The distribution of employees by experience in the QA industry, which was stable until 2020, has changed over the past four years. Thus, the number of Junior employees in the period 2015–2020 was on average ~23.3% with a fluctuation of ~2.1%, Middle on average ~55% with a fluctuation of ~1.5%, Senior on average ~22% with a fluctuation of ~1.5%.
In 2020-2021, the distribution among Middle and Senior changed to ~43% and ~34% on average, respectively. However, after 2022, a decrease in newcomers to the specialty and an increase in the number of Senior specialists were recorded. This may be evidence of both a decrease in newcomers' interest in the profession and an increase in the length of service of specialists in the industry.
The largest number of non-technical employees among all titles over the entire 10 years work in the field of HR. Among Junior employees in 2015, the second and third places in terms of number were occupied by Support and Sales employees (21.7% and 12%, respectively). Over the 10-year period, the share of these specialties has decreased, however, as of 2024, the second place in terms of number is still occupied by Support specialists (23.2%), and the third place is occupied by Marketing & PR with a share of 22.1%.
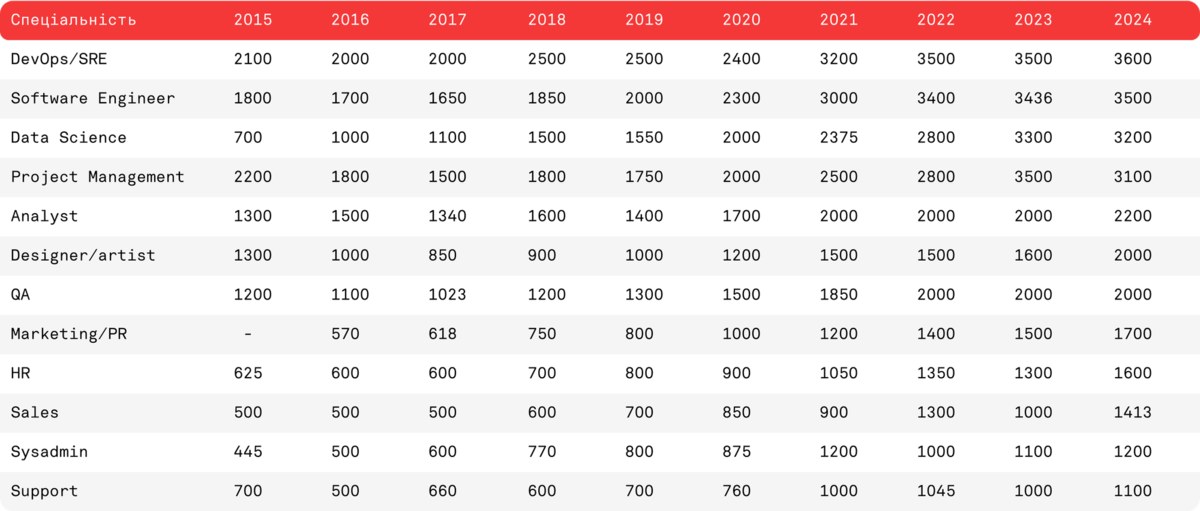
Salaries
The largest increase in median salary was recorded for Data Science specialists: $700 in 2015 versus $3,200 in 2024, which is equal to a 357% increase over a 10-year period.
Analyst and DevOps saw the least change. The median salary for an Analyst in 2015 was $1,300 and will reach an all-time high of $2,200 by 2024, a 69.2% increase. The median salary for a DevOps in 2015 was $2,100, and in 2016 and 2017 it reached an all-time low of 4.8% ($2,000), before reaching an all-time high of $3,600 in 2024, an 80% increase.
The photo below shows the dynamics of median salaries by experience: 1 — Junior employees, 2 — Middle, 3 — Senior.
The highest salary growth rates are observed at the Junior and Middle levels of non-technical specialties and average ~80% over a 10-year period. For technical Junior and Middle employees, salaries increased by ~23% on average over 10 years. For the Senior level, there is no such difference in the growth rate between technical and non-technical specialists: the growth is 51% for technical and 53% for non-technical employees.